Lies, Damn Lies and the Golf Ball Index

Like Janus looking to both past and present, economists, analysts and a wide range of armchair financial prognosticators are showering us with predictions for the coming economic year. So how about one more?
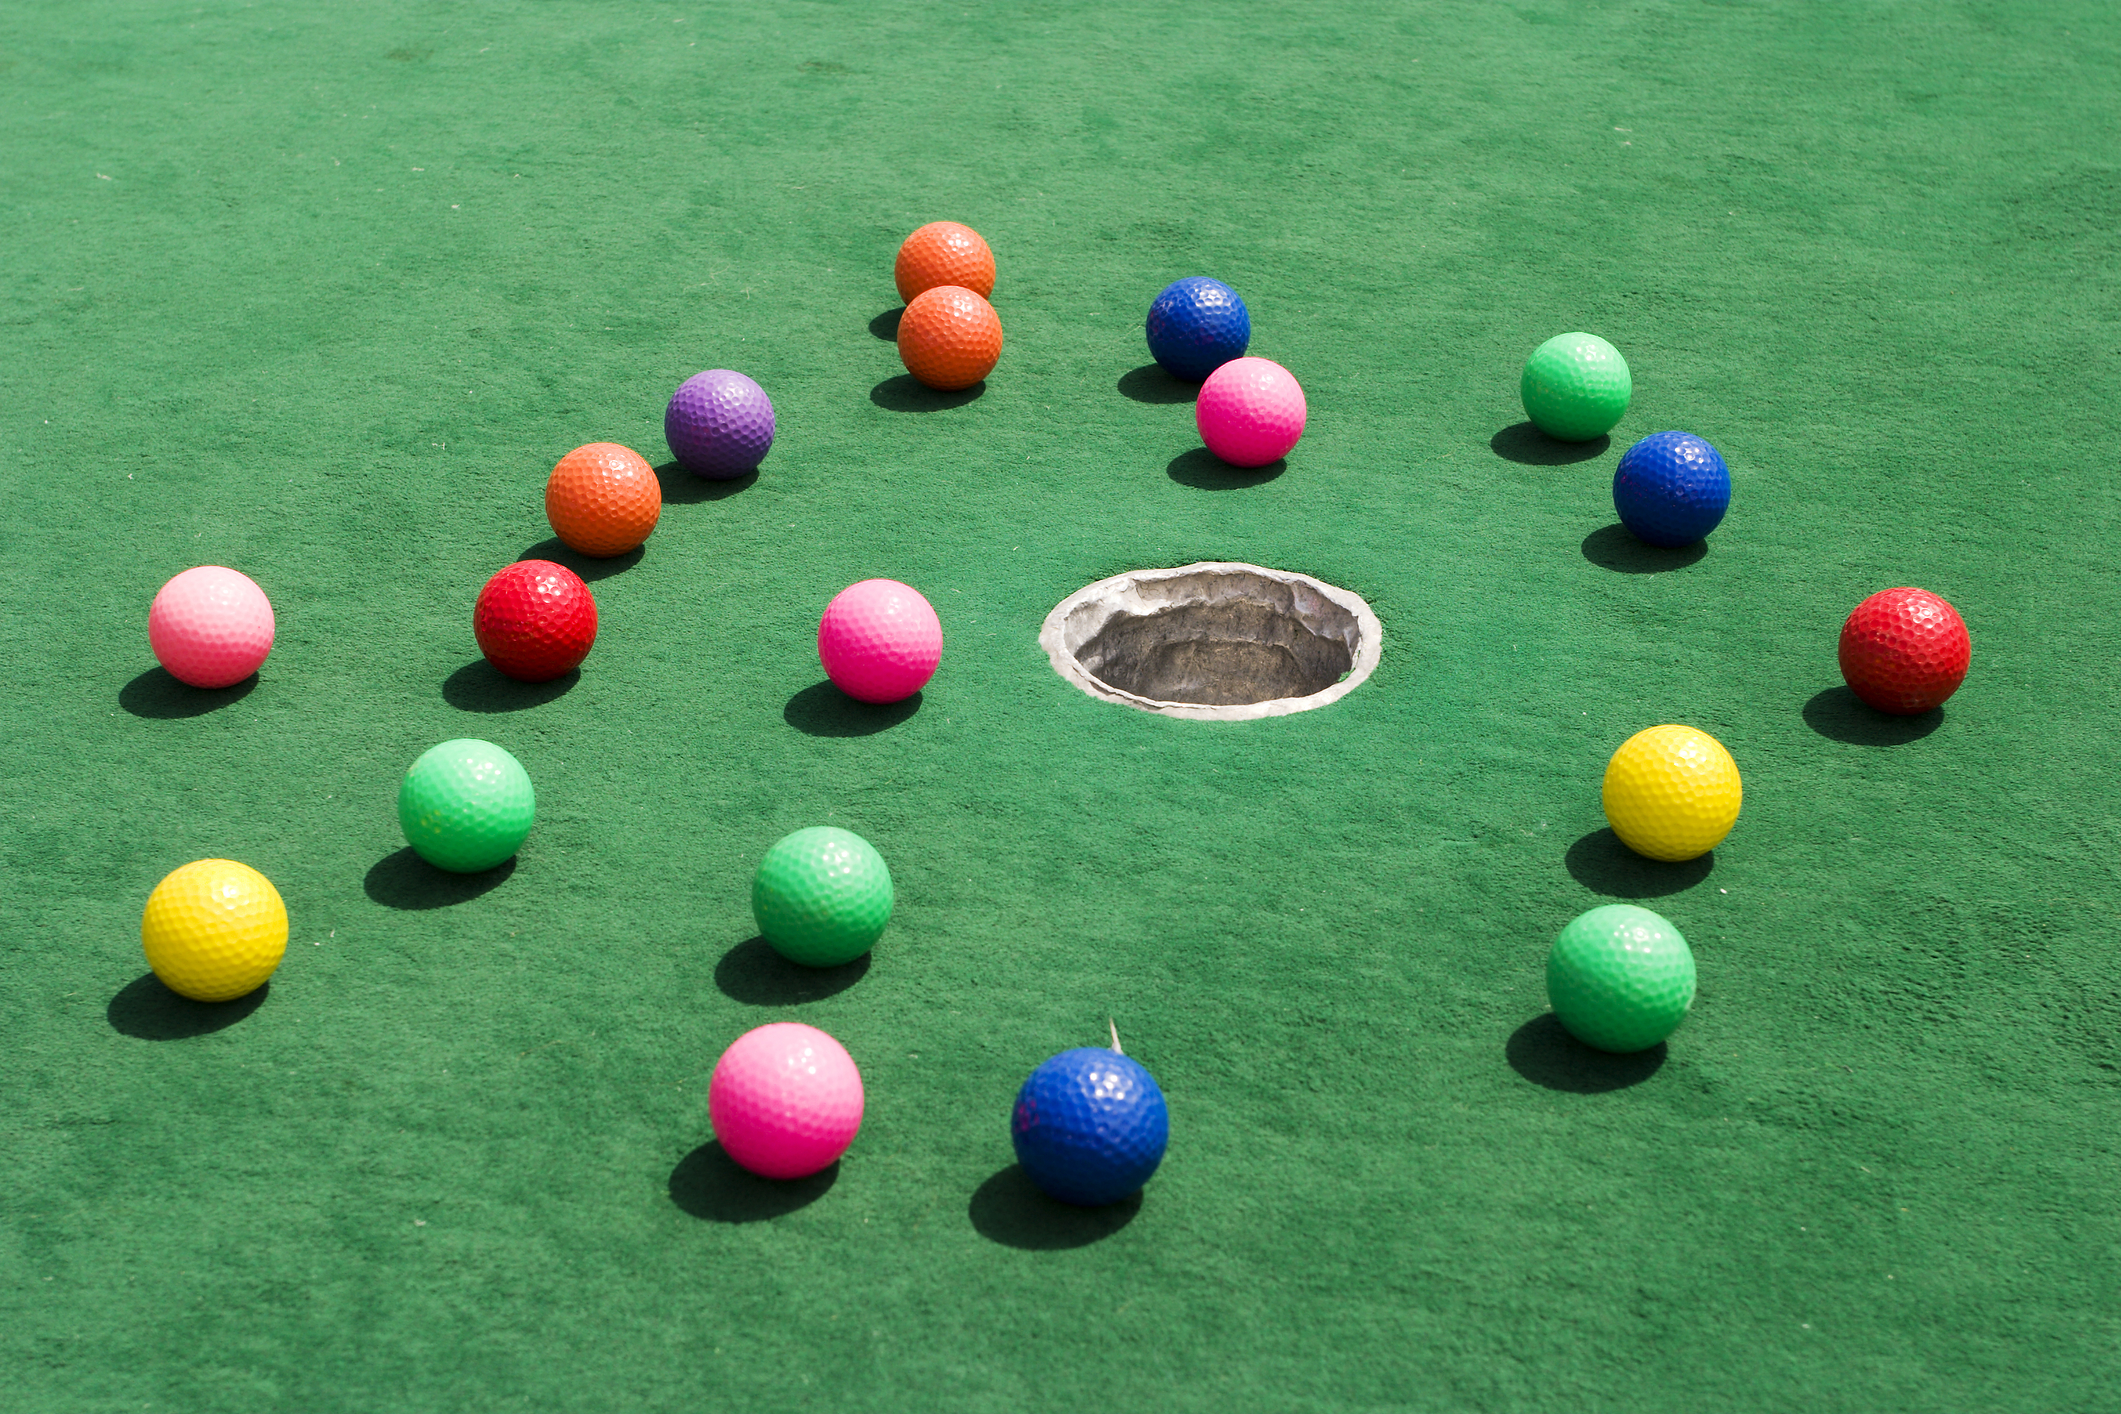
This newest bit of economic bloviation is the Golf Ball Index. It is a statistical model based on a range of recreational variables, including the number of golf balls manufactured annually, rate of golf balls lost or discarded, and relative replacement cost of said golf balls.
In many ways an offshoot of the Phillips curve – an economic theory that inflation and unemployment have a stable and inverse relationship – proponents of the Golf Ball Index contend there is a stable and inverse relationship between the number of golf balls lost and the hours spent on the practice range.
Consider the following statistics:
The average golfer plays 60 rounds of golf a year and loses and average of two golf balls per round. With 375 million rounds of golf played in the United States in an average year, that comes out to around 300 million golf balls lost at a cost of $300 million to $1.2 billion.
Using a typical Florida golf course as a baseline, it is possible to extrapolate the net economic effect of lost or discarded golf balls through empirical observation and statistical organization.
As Florida is home to the most golf courses in the U.S. at more than 1,200 and is the self-proclaimed “Golf Capital of the World” with the custom license plate to prove it, the Sunshine State can reasonably serve as a representative example of golf as a leading economic indicator.
Using a rolling set of golf balls lost on a typical par-4 hole measuring 335 yards for years 2020, 2021 and 2022, creates a statistically significant sample size to create a workable economic model.
Over the course of the three-year period, a total of 403 golf balls were recovered in the control zone 150 yards from the green. The yearly totals are 135 balls in 2020; 165 balls in 2021 and 103 balls in 2022.
After allowing for decreased golfing activity in 2020 due to the Covid-19 pandemic and increased golf rounds in 2021 due to pent-up demand, the 103-ball figure for 2022 represents a meaningful decline in golf activity and associated discretionary spending.
Expressed as a formula, the Golf Ball Index would be Discretionary Spending on golf balls (D) multiplied by the rate golf balls are replaced – or Velocity (V) – equals nominal economic growth or decline. Thus, the Golf Ball Index measures consumption of golf balls as a determinant of rates of consumer confidence, consumer spending and confidence in clearing the water hazard.
Therefore, the decline in golf ball losses relative to pre-pandemic levels indicates a softening of discretionary spending, and reflects a higher likelihood of recession in the next 12 months.
Of course, like any economic theory or model, the Golf Ball Index is open to interpretation. And we shouldn’t forget the old cliché that economists exist to make meteorologists look good – and take economic predictions and weather forecasts with a grain of salt.
Put another way, the chances an economic theory – even one buttressed by a wealth of statistical data – can accurately forecast the future course of the economy are about as good as I can predict where my next tee shot will go.


